Outreach Details Report
Modified on Thu, 16 Oct, 2025 at 5:18 AM
TABLE OF CONTENTS
Introduction
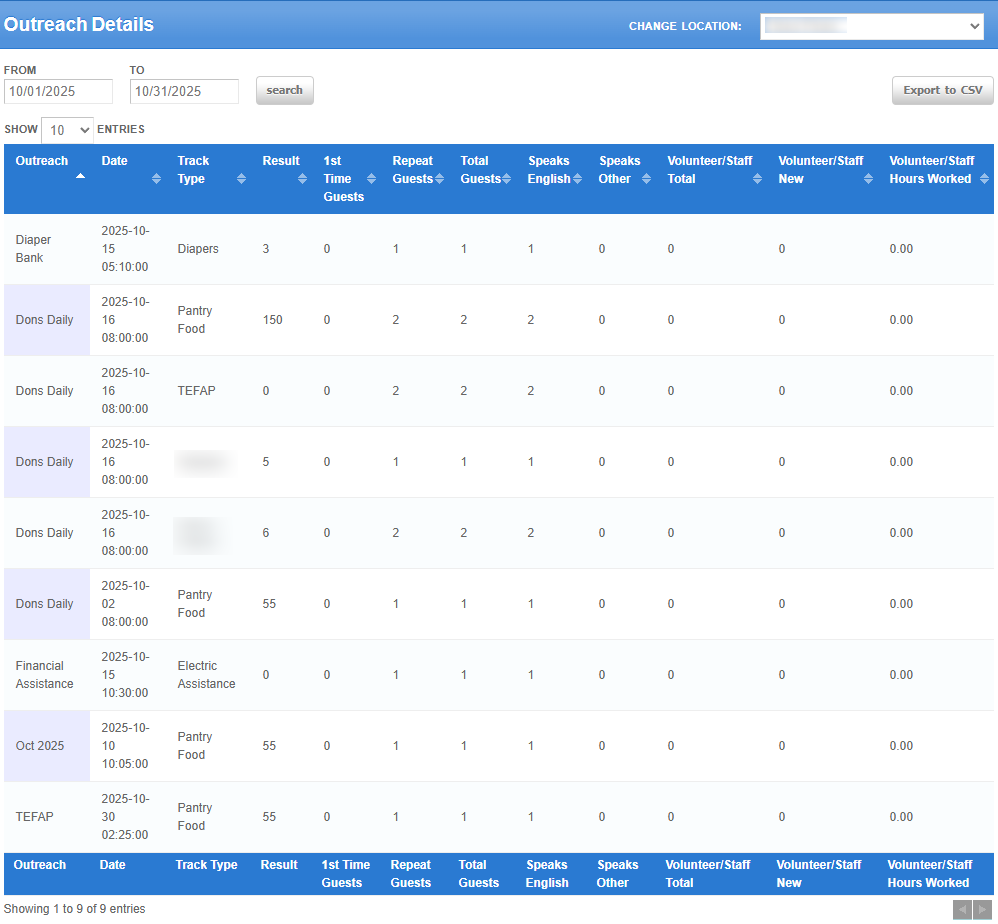
The Outreach Details Report provides specific data for each outreach event within a selected date range.
This report includes the following information:
- Tracking Result
- First-Time Households (new to your agency)
- Repeat Households (have visited before)
- Total Combined Households (new and have visited before)
- Speaks English
- Speaks Other Languages
- Nationality/Race Statistics
- Age Group Breakdown
This report automatically organizes and displays each outreach that occurred within the selected date range. It also includes all tracking types (e.g., USDA Food, Bread, Produce, etc.) that your agency records.
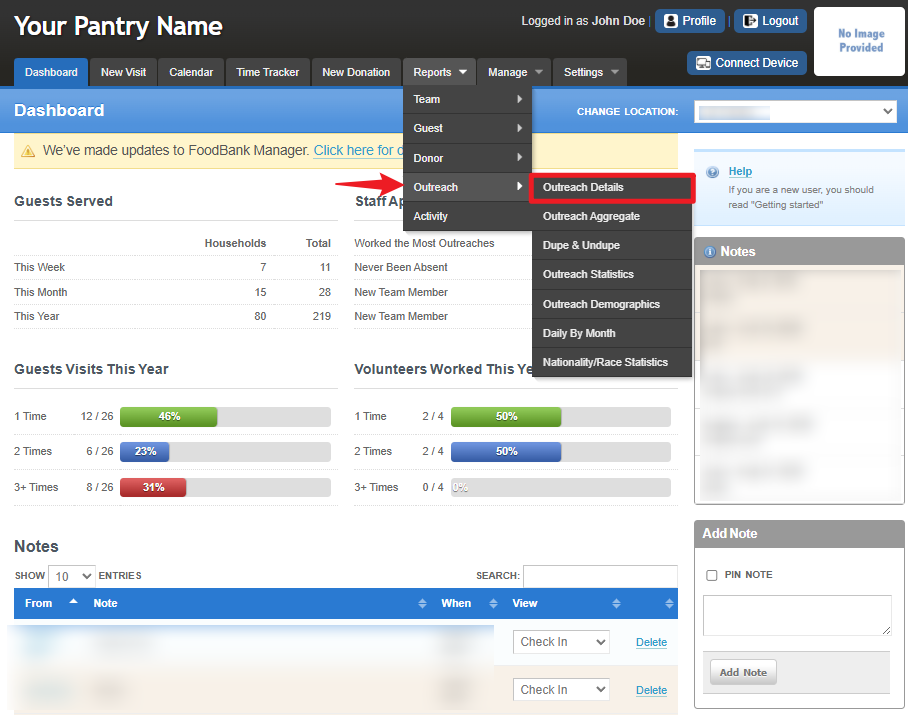
To access the report, go to Reports > Outreach > Outreach Details.

To configure the report, set the desired date range for your data selection.
Click the “From” date box and use the date picker to select the starting date.
Repeat the same process for the “To” date box to select the end date for your report.

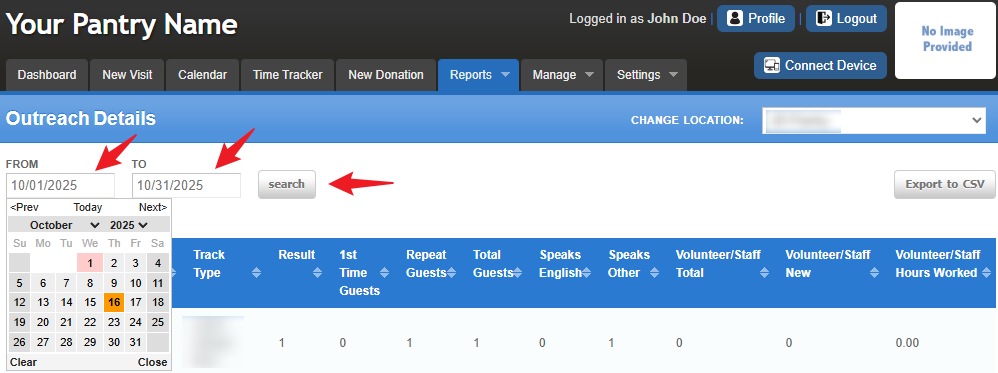
Once your date range is set, click the “Search” button to generate and display the report data on the screen.
Please note that not all data may be visible within the dashboard. To view the complete dataset, click the “Export to CSV” button located in the top-right corner. This allows you to open the full report in Excel for further review.
Note: This provides the outreach numbers for the entire month but broken down by each individual outreach and tracking method.Understanding the Column Headers
It’s important to understand what each column represents to accurately interpret the data in your report. Below is a breakdown of each column:
Outreach: Displays the outreach name. Some agencies name outreaches by the day of the week, while others use On-Demand outreaches with the same name for all events.
Date: Shows the date when the outreach occurred.
Track Type: Lists the type of goods or services provided (e.g., Food, Clothing). Each tracking type is displayed as a separate line item.
Result: Displays the calculated totals for each track type (e.g., household totals for food or weight for clothing).
1st Time Guests: Shows the number of new households visiting your pantry for the first time. Each guest represents a household.
Repeat Guests: Shows the number of returning households that have previously visited. Each guest represents a household.
Total Guests: Displays the combined total of first-time and repeat household visits for that day.
Nationality/Race Columns: Lists each nationality/race category configured in your system. The values represent the number of households identifying with each category.
Age Group Columns: Displays the total number of individuals from visiting households, grouped by age range.
How to Use This Report
This report is especially helpful for analyzing data from a specific outreach without needing to limit the date range to a single day.
Example:
If you suspect that more first-time households attend your Wednesday evening outreach, you can use this report to compare attendance between different days and calculate an average.
Get creative—use these insights to evaluate trends, improve your outreach efforts, and strengthen support for the communities you serve!
Was this article helpful?
That’s Great!
Thank you for your feedback
Sorry! We couldn't be helpful
Thank you for your feedback
Feedback sent
We appreciate your effort and will try to fix the article