The Visit Frequency Report is a valuable tool for both fiscal and program planning. It also helps address common misconceptions about guests frequently returning for assistance or “abusing the system”.
This report provides key insights within a selected date range, including:
The total number of visits made by households.
The total number of visits made by individuals.
The percentage of total households that made visits.
The percentage of total individuals that made visits.
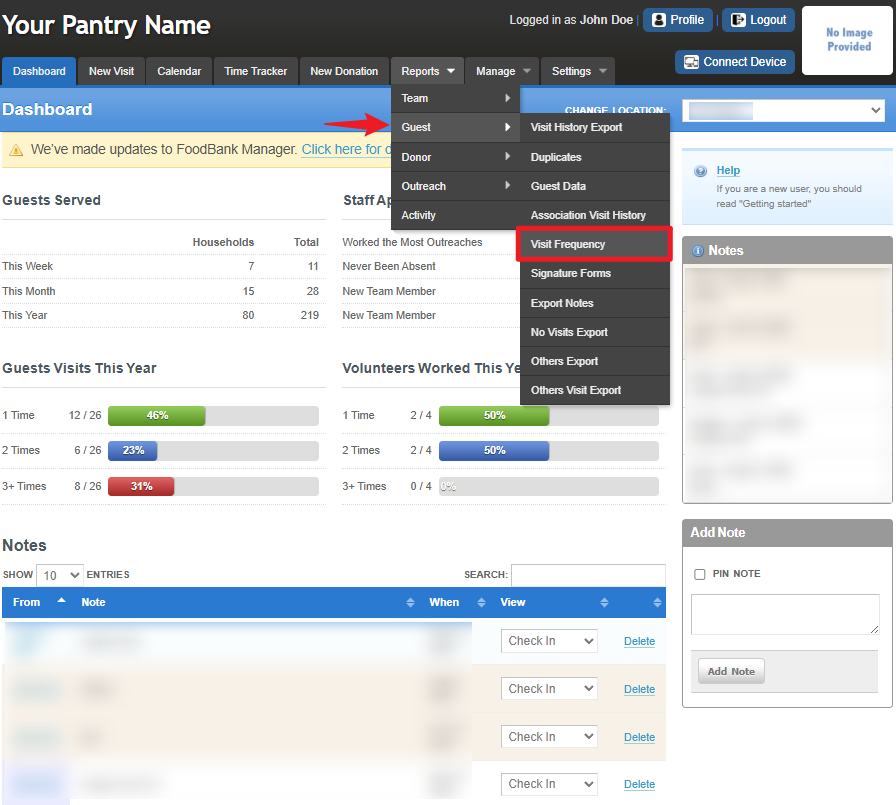
To access this report, go to the Reports tab at the top of your dashboard. From the dropdown menu, hover over Guest, then select Visit Frequency from the submenu to open the report.
To configure the report, start by setting the date range for the data you want to include. Click the From date field and use the date picker to select the starting date. Then, click the To date field and choose the ending date for your report using the same method.
Click on the "Track Type" box to see a list of all of the services provided and choose the one to be reported on.
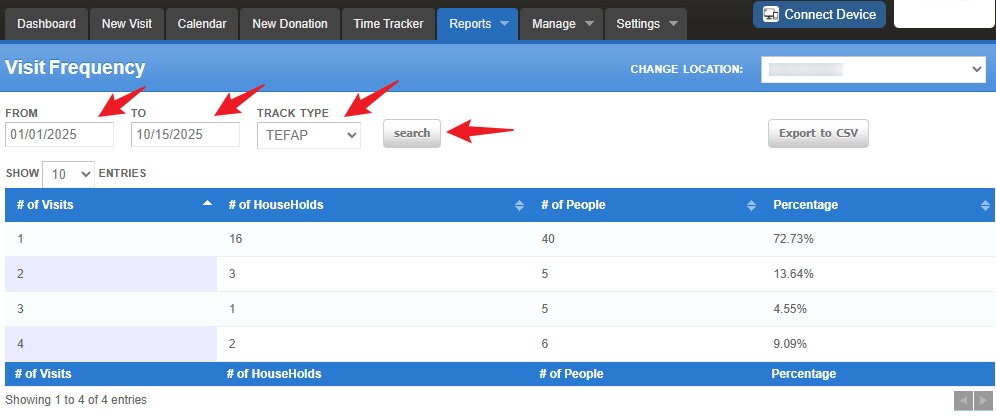
Now that your report is configured for the data needed, click on the "Search" button. This will show you the requested numbers on the screen. You can also click on the "Export to CSV" button, found at the top right hand side of the screen. Export the report to have a paper copy or to customize the data to your needs or place in another report format.
Note: The image above is a report from a sample pantry. The date sample is for a fiscal year 01/01/2025 to 10/15/2025 and is reporting out the "TEFAP" track type. This provides the visit frequency numbers for the entire fiscal year.ChatGPT said:
Note: The numbers provided to you in this report will always be unduplicated.Evaluating Services and Strategic Planning
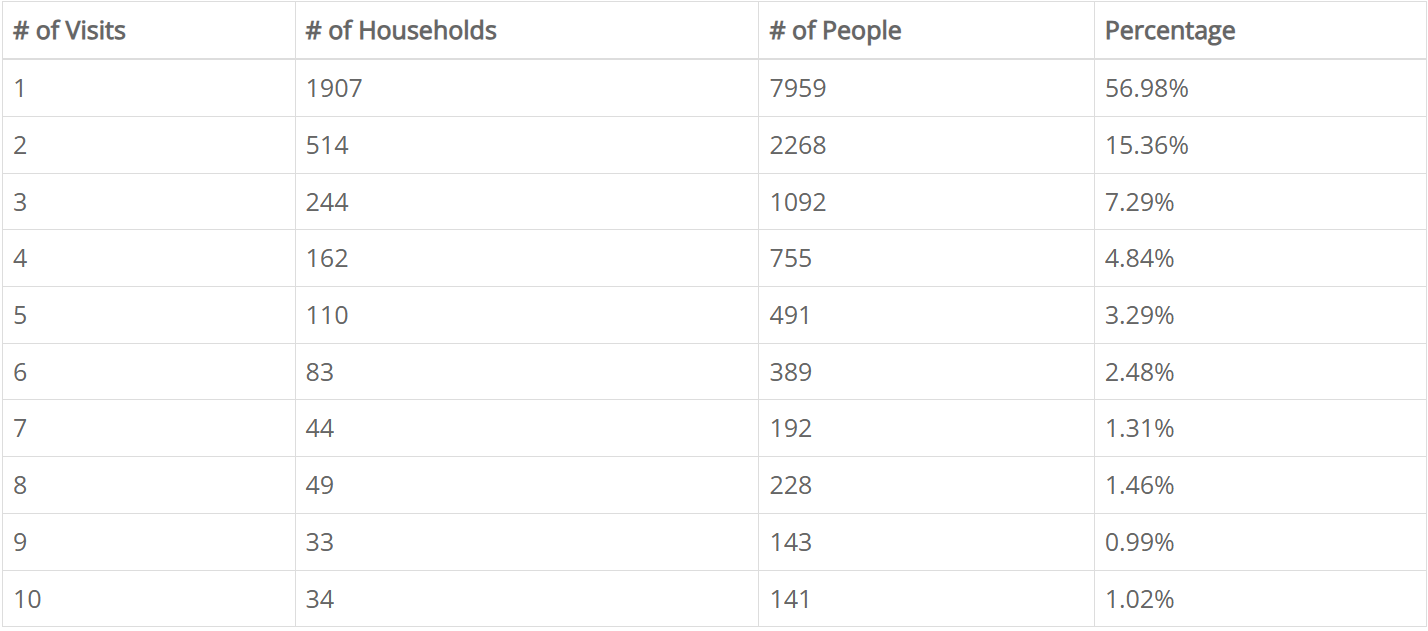
The data shows that about three-quarters of all clients visited two times or less in a year — with 57% visiting only once. This insight can help your organization reflect on how effectively your services are meeting client needs.
Here are some guiding questions to consider:
Are clients receiving the maximum benefit possible during their limited visits?
Is the amount of food or assistance provided per visit sufficient?
Could there be reasons—other than lack of need—why households are not returning? (For example, was the experience challenging? Would a client feedback survey help identify improvements?)
Does your current food or service budget allow for increased support per household, such as higher food limits or additional household/non-food items?
Alternatively, if your data shows that clients are visiting more frequently than expected, explore what the numbers might reveal. Could this reflect a higher demand in your service area, job loss trends, or gaps in other community support services?
Use these findings to shape your messaging, demonstrate your agency’s real impact, and guide future planning. Accurate data empowers your organization to make informed, strategic decisions that strengthen your mission and community outreach.
Examples of How to Make Use of this Report
Dispelling Myths
There is often a common misconception about individuals who seek assistance frequently. As advocates for our clients and leaders within our organizations, this report can serve as a valuable tool to counter these myths by presenting clear, data-driven evidence.
Example:
If your agency wants to analyze how often clients visited the pantry within a fiscal year, you can generate the Visit Frequency Report, export it to Excel, and customize the data as needed.
The resulting chart might show that xx.xx% of clients visited two times or less during the year, and xx.xx% visited six times or less. This data can be used to demonstrate that the majority of clients do not overuse services. Instead, they likely turn to the pantry during short-term periods of hardship to stabilize their situation and manage essential expenses such as rent, medical bills, or other financial obligations.
Was this article helpful?
That’s Great!
Thank you for your feedback
Sorry! We couldn't be helpful
Thank you for your feedback
Feedback sent
We appreciate your effort and will try to fix the article